
uniapp+vue3+ts+vite+echarts开发图表类小程序,将echarts导入项目使用的详细步骤,耗时一天终于弄好了
想在uniapp和vue3环境中使用echarts是一件相当前卫的事情,官方适配的还不是很好,echarts的使用插件写的是有些不太清晰的,这里我花费了一天的时间,终于将这个使用步骤搞清楚了,并且建了一个仓库,大家可以直接clone下来使用。先看一下pc端和小程序端的效果: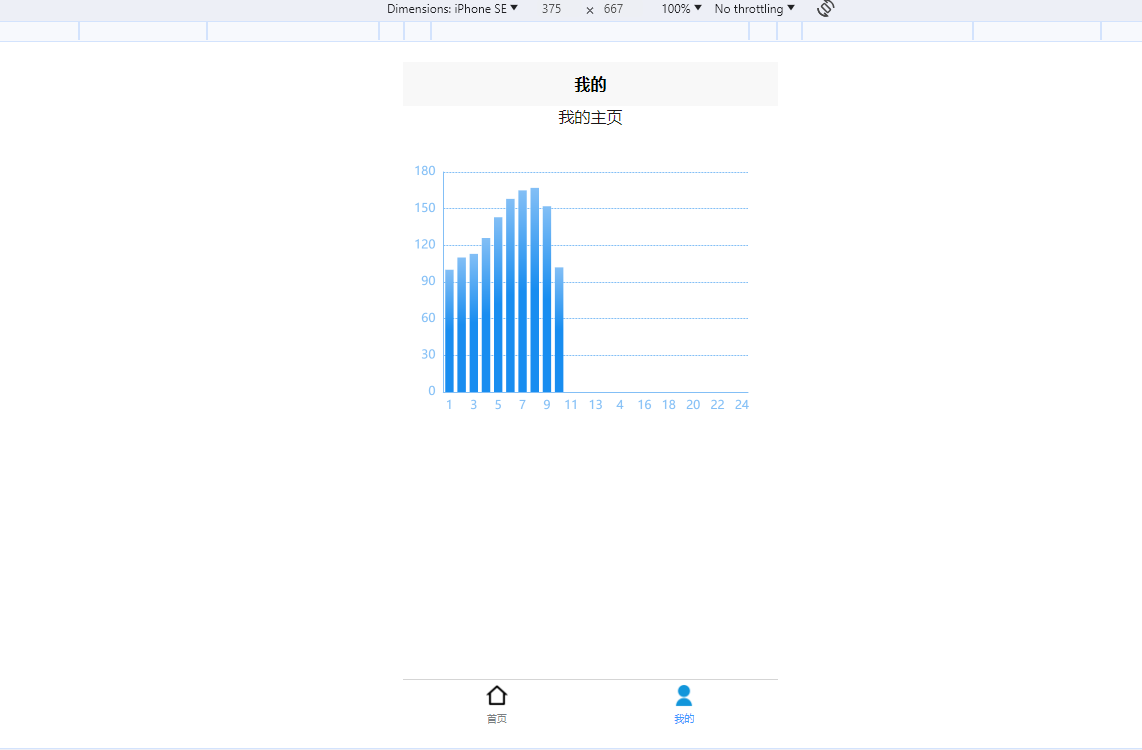
微信小程序和抖音小程序等都支持: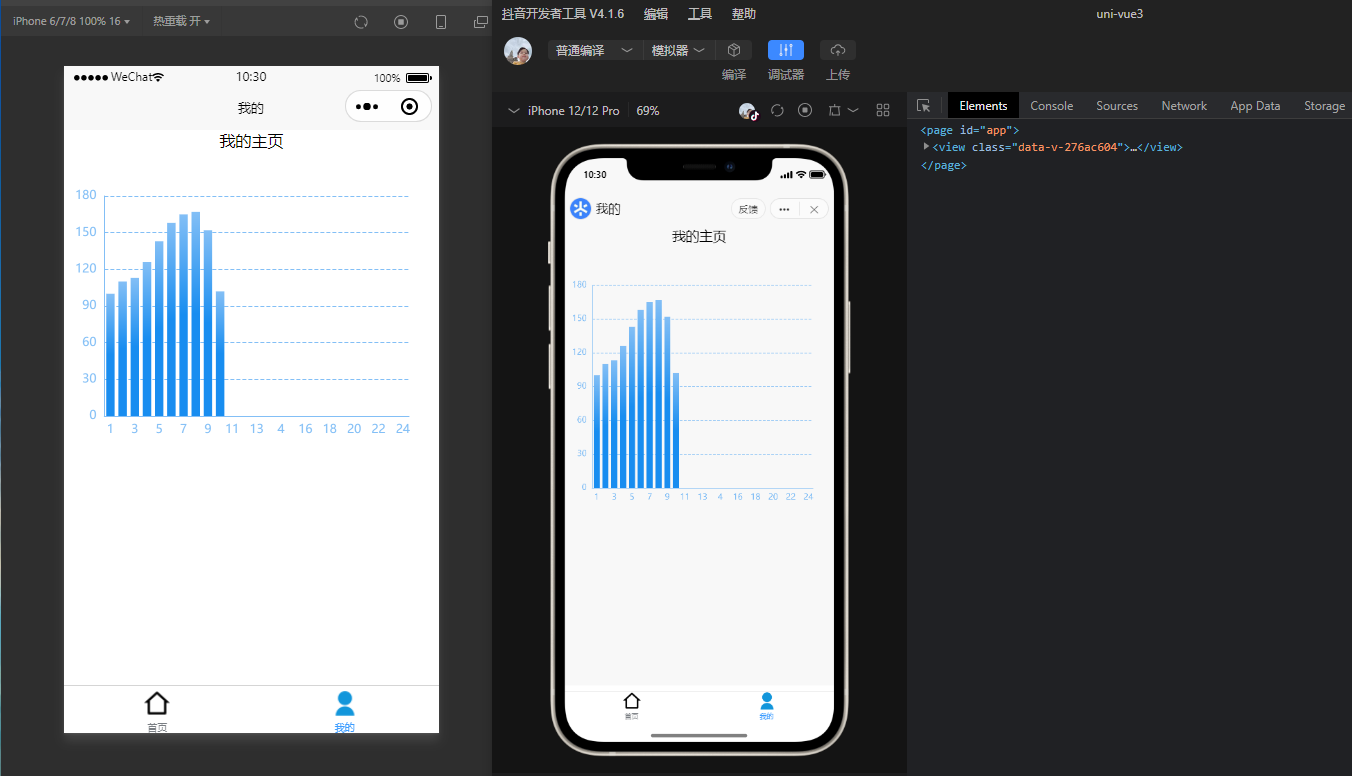
使用步骤如下
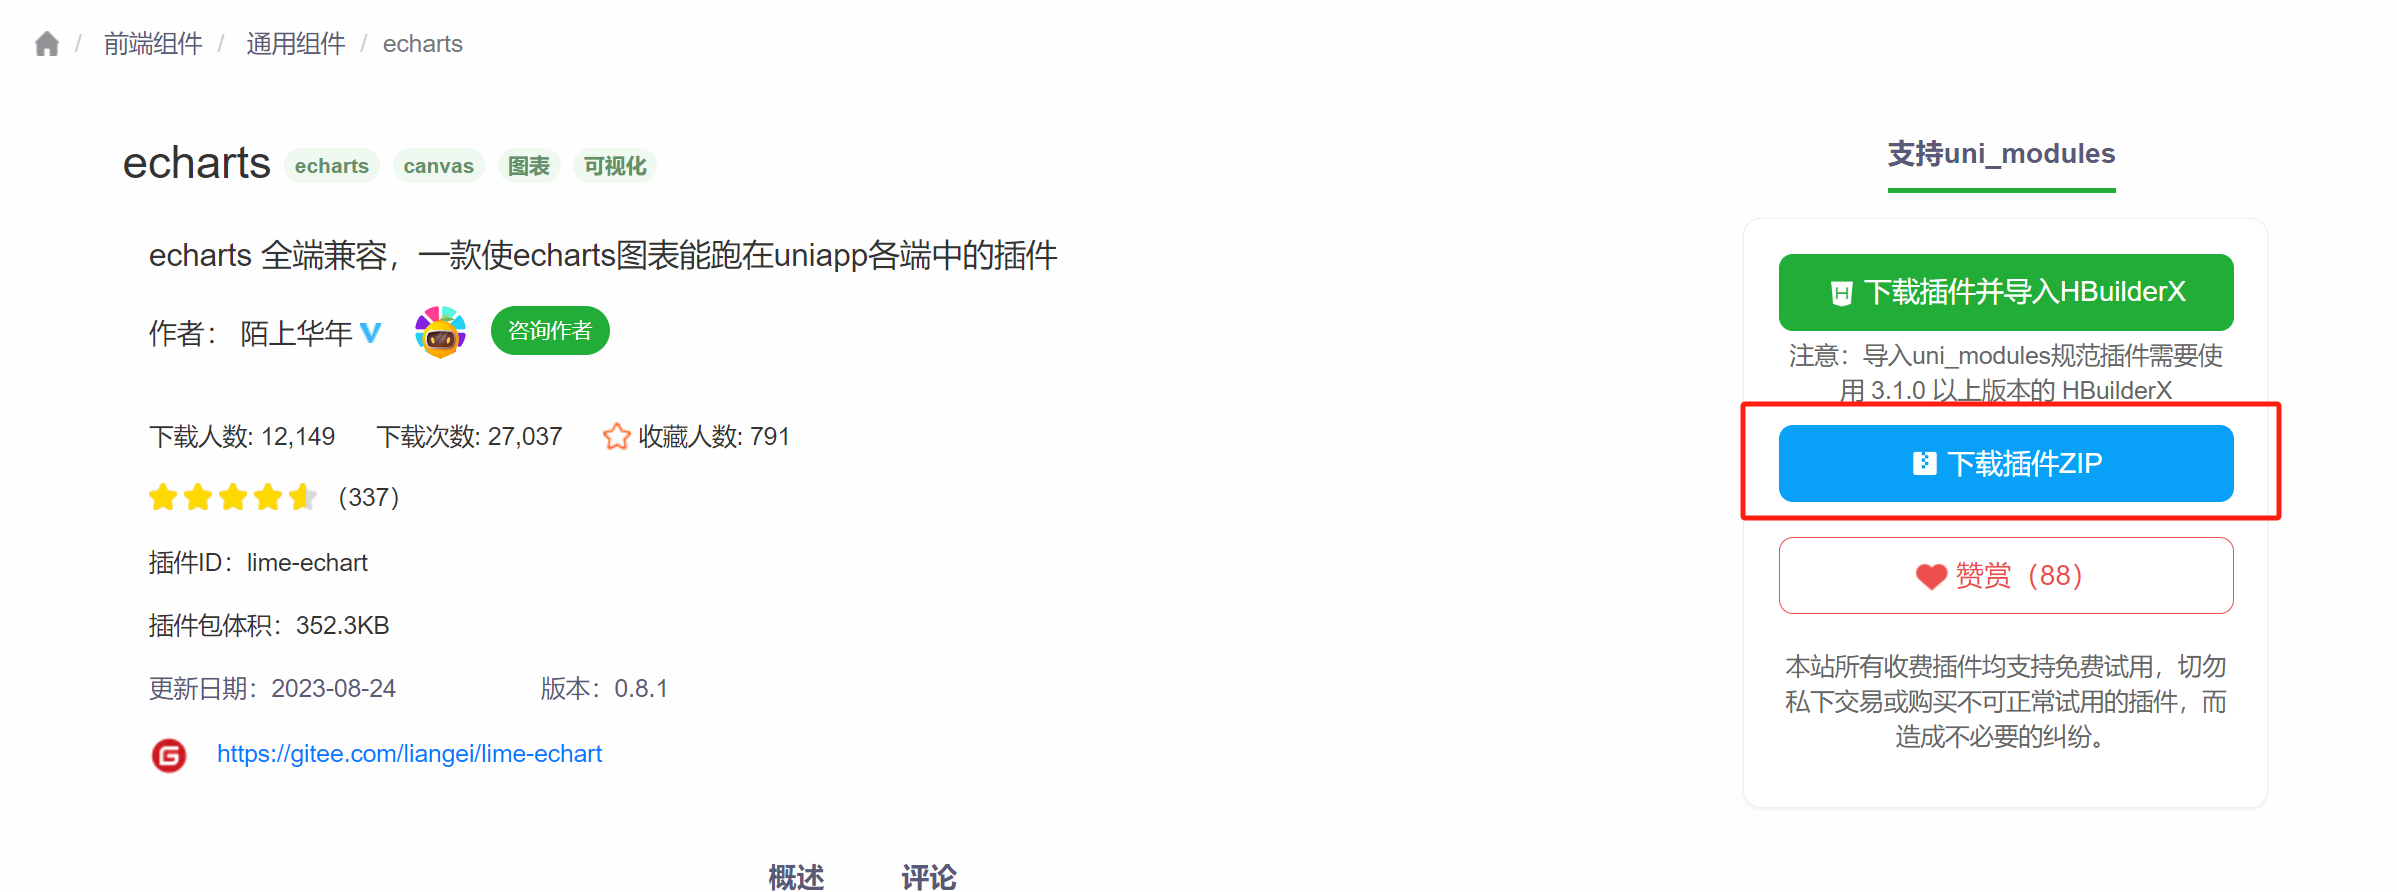
第一步:下载插件包
下载echarts插件包,并导入到项目中,然后使用插件中的组件创建容器,并导入数据就可以了。
echarts插件包地址:echarts - DCloud 插件市场
如果你是使用hbuilder写的,可以直接导入,如果你是vscode写的,就下载压缩包:
我这里将我下载好的zip包分享出来:lime-echart_0.8.1.zip - 蓝奏云
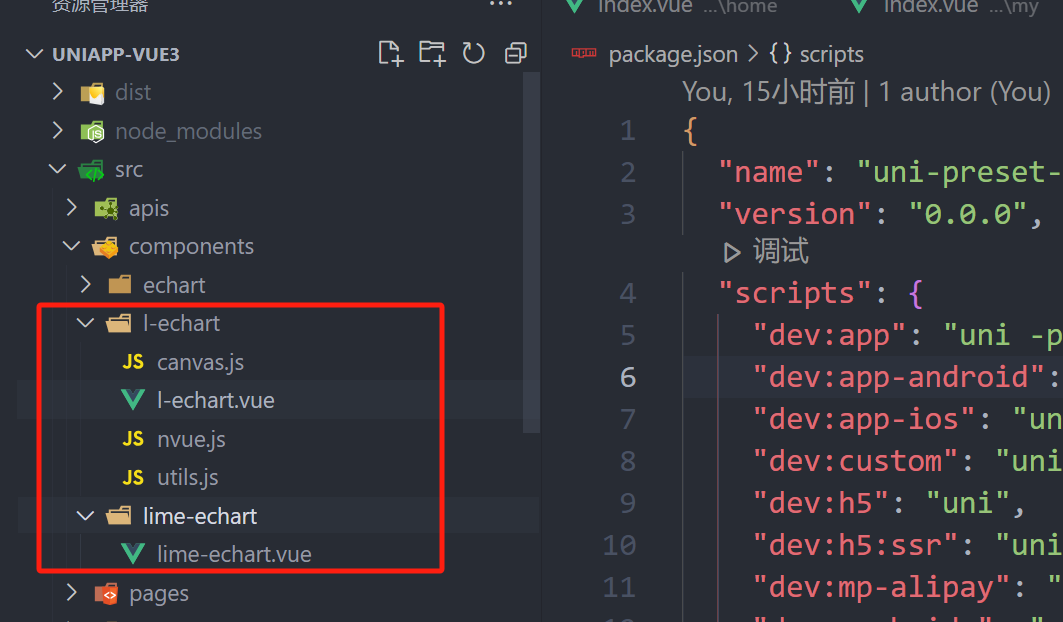
下载好解压然后将解压后的组件导入到项目的components下面:
并且将静态资源放到静态文件夹中: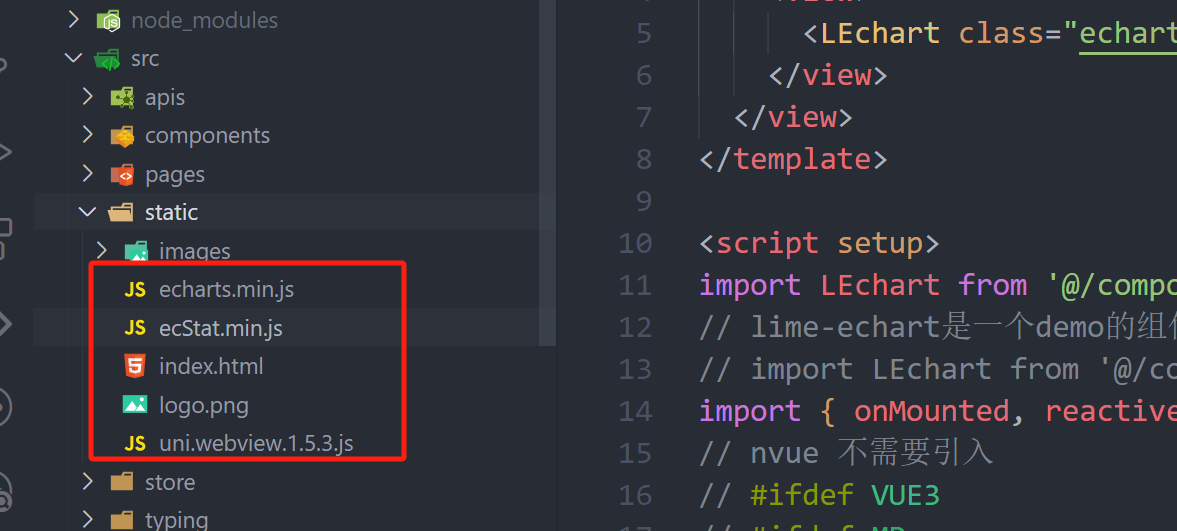
第二步:安装echarts包
pnpm add echarts
-or-
npm install echarts
第三步:在页面中导入依赖并运行
然后在页面中导入这个LEchart这个组件: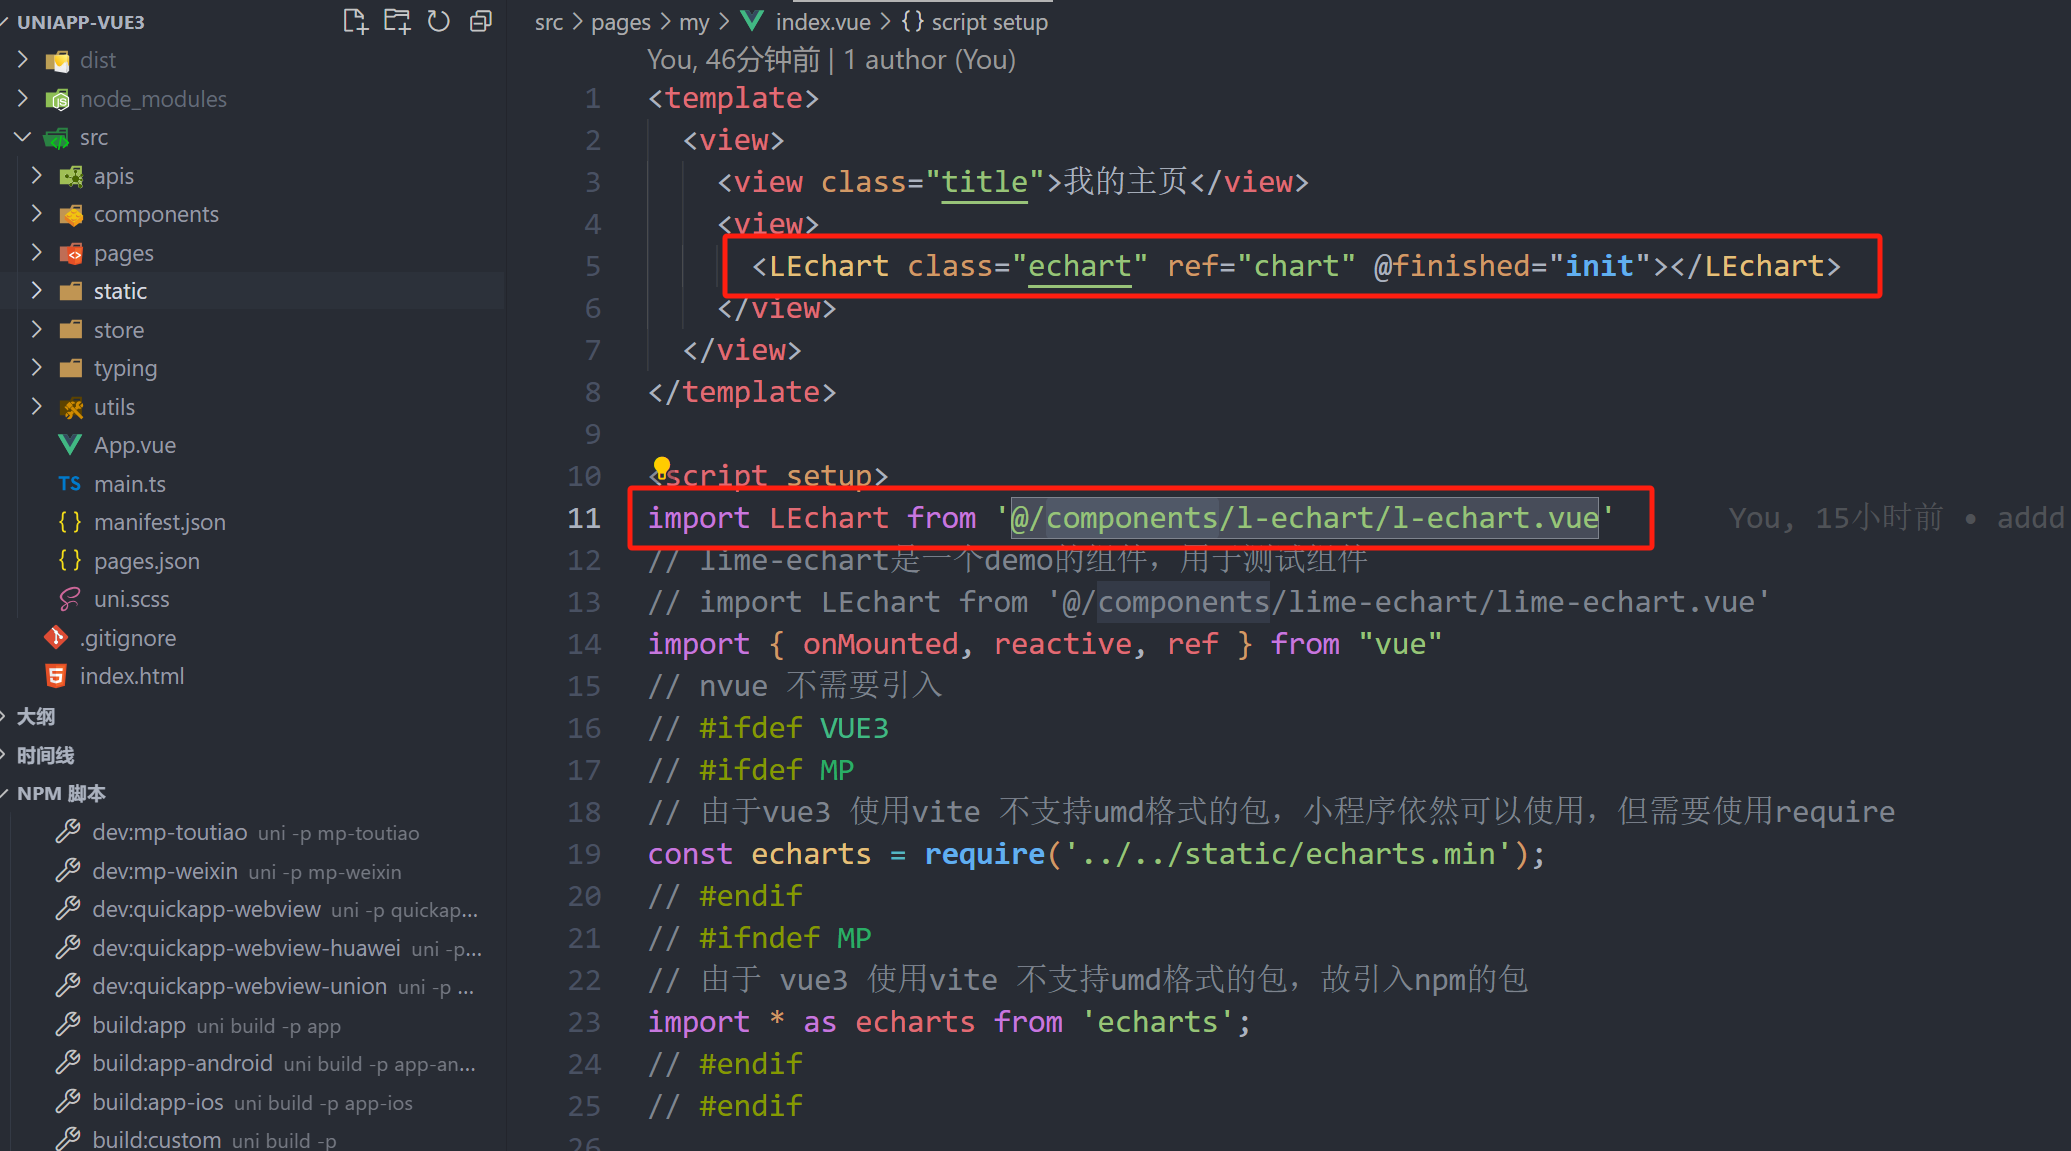
将依赖按照不同的平台区分导入到页面组件中:下面是我的页面源代码
    我的主页


import LEchart from '@/components/l-echart/l-echart.vue'
// lime-echart是一个demo的组件,用于测试组件
// import LEchart from '@/components/lime-echart/lime-echart.vue'
import { onMounted, reactive, ref } from "vue"
// nvue 不需要引入
// #ifdef VUE3
// #ifdef MP
// 由于vue3 使用vite 不支持umd格式的包,小程序依然可以使用,但需要使用require
const echarts = require('../../static/echarts.min');
// #endif
// #ifndef MP
// 由于 vue3 使用vite 不支持umd格式的包,故引入npm的包
import * as echarts from 'echarts';
// #endif
// #endif
let chart = ref(); // 获取dom
const state = reactive({
  option: {},
})
state.option = {
  legend: {
    show: true,
    data: []
  },
  tooltip: {
    trigger: 'axis',
    axisPointer: {
      type: 'cross'
    }
  },
  grid: {
    left: '3%',
    right: '8%',
    top: '15%',
    bottom: '5%',
    containLabel: true
  },
  xAxis: {
    type: 'category',
    data: [1, 2, 3, 4, 5, 6, 7, 8, 9, 10, 11, 12, 13, 1, 4, 15, 16, 17, 18, 19, 20, 21, 22, 23, 24],
    axisLabel: {
      // inside: true,
      // color: '#fff'
    },
    axisTick: {
      show: false
    },
    axisLine: {
      show: true,
      lineStyle: {
        color: '#83bff6'
      }
    },
    z: 10
  },
  yAxis: {
    type: 'value',
    axisLine: {
      show: true,
      lineStyle: {
        color: '#83bff6'
      }
    },
    axisTick: {
      show: false
    },
    // axisLabel: {
    //   color: '#999'
    // },
    splitLine: {
      show: true,
      lineStyle: {
        type: 'dashed',
        color: '#83bff6'
      }
    }
  },
  series: [
    {
      data: [100, 110, 113, 126, 143, 158, 165, 167, 152, 102, ,],
      type: "bar",
      itemStyle: {
        color: new echarts.graphic.LinearGradient(0, 0, 0, 1, [
          { offset: 0, color: '#83bff6' },
          { offset: 0.5, color: '#188df0' },
          { offset: 1, color: '#188df0' }
        ])
      },
      emphasis: {
        itemStyle: {
          color: new echarts.graphic.LinearGradient(0, 0, 0, 1, [
            { offset: 0, color: '#2378f7' },
            { offset: 0.7, color: '#2378f7' },
            { offset: 1, color: '#83bff6' }
          ])
        }
      },
      areaStyle: {
        show: true,
        color: new echarts.graphic.LinearGradient(0, 0, 0, 1, [
          {
            offset: 0,
            color: '#188df0'
          },
          {
            offset: 1,
            color: '#fff'
          }
        ])
      },
    }
  ],
  color: ['#83bff6']
}
// 组件能被调用必须是组件的节点已经被渲染到页面上
onMounted(() => {
  chart.value.init(echarts, chart => {
    chart.setOption(state.option);
  });
})
// 渲染完成
const init = () => {
  console.log("渲染完成");
}


.echart {
  width: 100%;
  height: 300px;
}
.title {
  text-align: center;
}
最后运行小程序或者h5就可以看到效果了: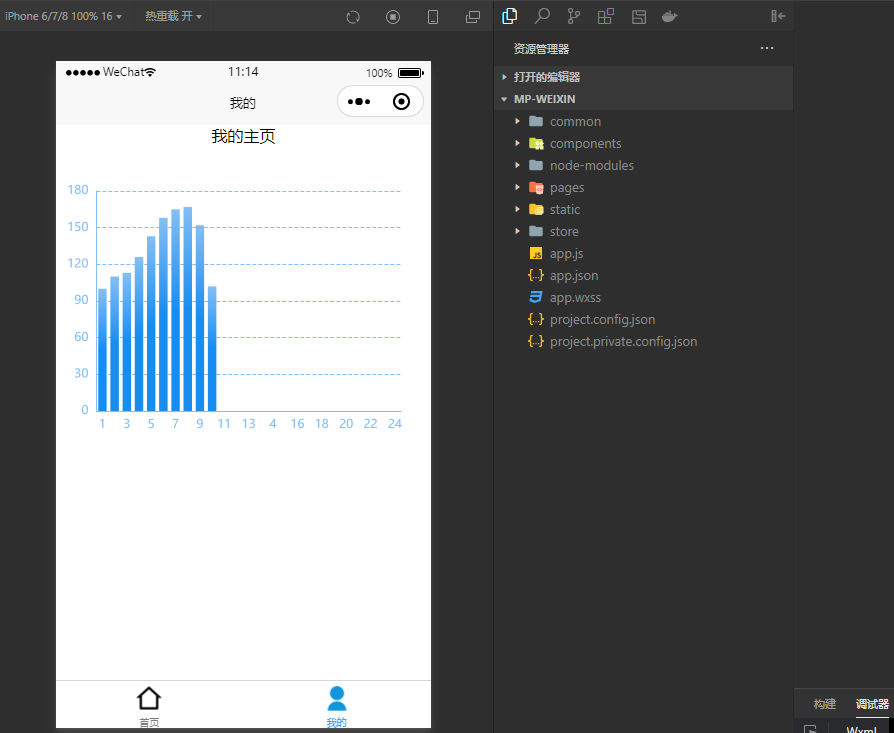
免责声明:我们致力于保护作者版权,注重分享,被刊用文章因无法核实真实出处,未能及时与作者取得联系,或有版权异议的,请联系管理员,我们会立即处理! 部分文章是来自自研大数据AI进行生成,内容摘自(百度百科,百度知道,头条百科,中国民法典,刑法,牛津词典,新华词典,汉语词典,国家院校,科普平台)等数据,内容仅供学习参考,不准确地方联系删除处理! 图片声明:本站部分配图来自人工智能系统AI生成,觅知网授权图片,PxHere摄影无版权图库和百度,360,搜狗等多加搜索引擎自动关键词搜索配图,如有侵权的图片,请第一时间联系我们,邮箱:ciyunidc@ciyunshuju.com。本站只作为美观性配图使用,无任何非法侵犯第三方意图,一切解释权归图片著作权方,本站不承担任何责任。如有恶意碰瓷者,必当奉陪到底严惩不贷!


